Android Tutorial Android Charts Framework

Status
Not open for further replies.
The purpose of this framework is to allow you to easily add different types of charts to your projects.
The current version supports pie charts, line charts and bar charts.

The framework is implemented as code modules. You are free to customize the code as needed.

I also recommend you to go over the code. It demonstrates several concepts including: usage of custom types, drawings, string measurements and region clipping.
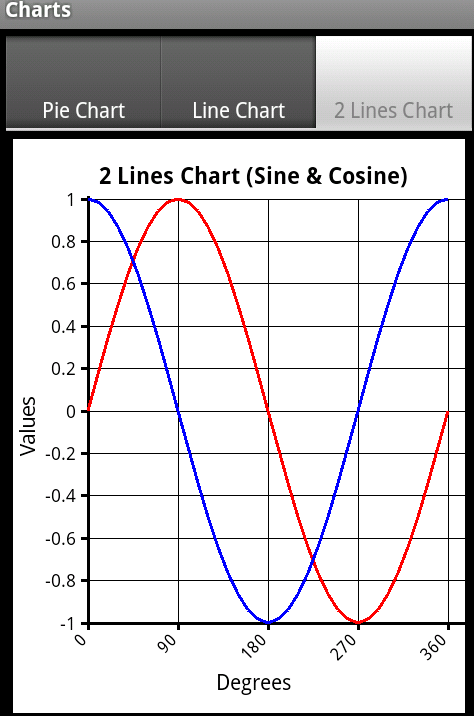
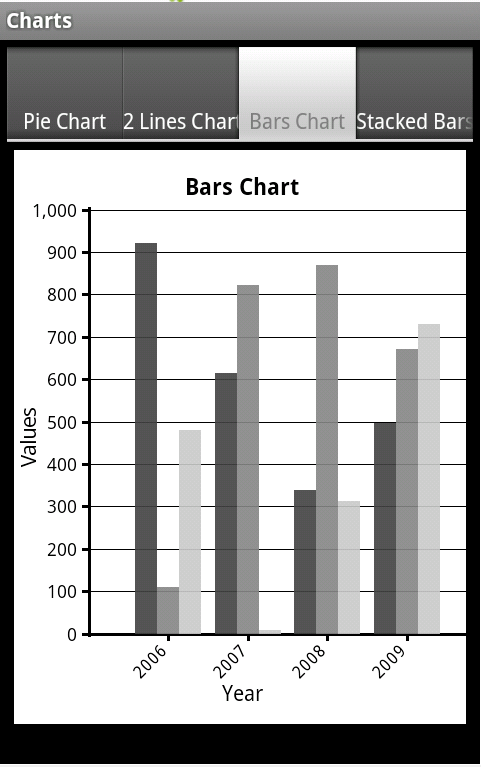
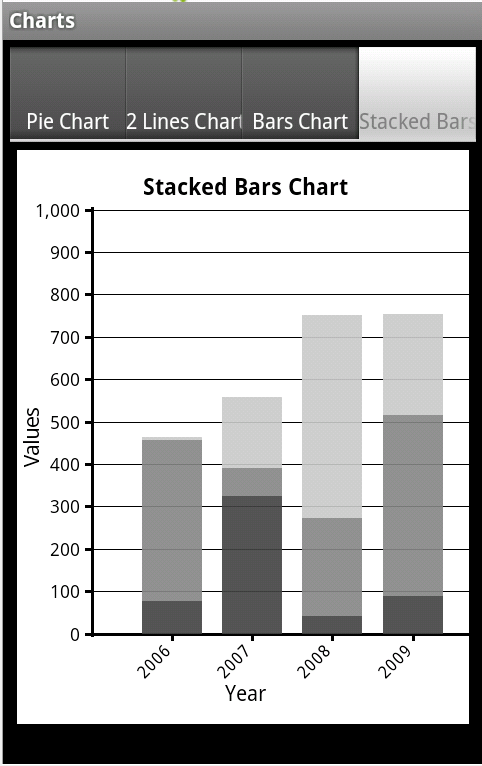
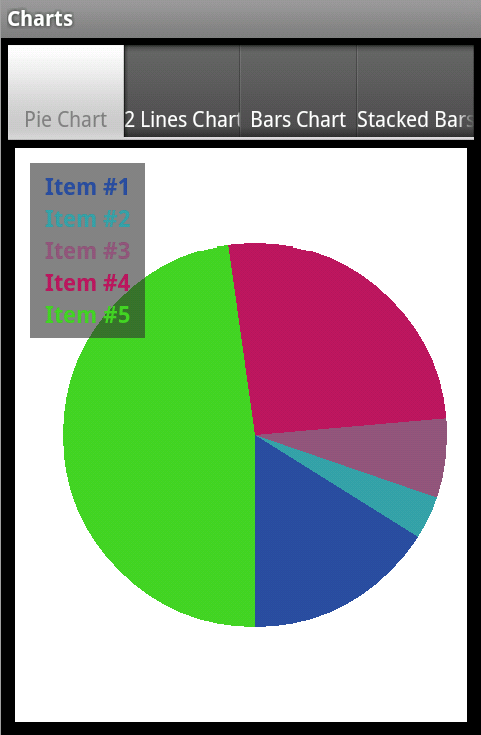
charts_2.png

charts_bars.png

charts_stackedbars.png


charts_pie.png


The code module is attached as part of the example project.
Questions, comments and suggestions are welcomed.

Klaus has posted a version that includes automatic scaling: http://www.b4x.com/android/forum/threads/android-charts-framework.8260/page-7#post-240181
 

Attachments

  • Charts.zip
    9.6 KB · Views: 7,853
Last edited:

Erel

B4X founder
Staff member
Licensed User
Longtime User
First post was updated with a new version. This version adds support for line charts.
A line chart can show a single line or multiple lines.
Some notes about the line chart:
- The X axis values are treated as strings.
- The Y axis values are treated as numbers.
- The data is added by adding the next X point. For this point you need to supply the Y value in case of a single line, or an array of Y values in case of multiple lines.

The code in the first post demonstrates both a single line and multiple lines charts.

All the drawing code is included in the Charts module. You are free to customize it as needed.
 

tresor

New Member
Licensed User
Longtime User
Vertical lines

Hello, I´m trying to draw a vertical line in a multiline chart, like changes between 0 and 1 in binary code or like a rectangle with vertical lines. When I use the multiline chart facilities of B4A and I plot a new point, the x-axis value is incremented 1 step so I never get a vertical line but a slope. Does anyone know how to draw a vertical line in a multiline chart? Thank you in advance.
 

tresor

New Member
Licensed User
Longtime User
Thanks. I´ve got it. At the end of "Sub Create2LinesTab" I appended a sentence LD.Canvas.DrawLine() and it works. Also I put a sentence LD.Canvas.DrawCircle() and it works also.
 

Nyptop

Active Member
Licensed User
Longtime User
I get the error 'Error description: Unknown type: graph Are you missing a library reference?'. Any suggestions?

Thanks
 

Nyptop

Active Member
Licensed User
Longtime User
Thanks Erel,

One question still though: How is the layout laid out? I'm having problems knowing what to do with panels.

Thanks Again,

Neil
 

Nyptop

Active Member
Licensed User
Longtime User
Still having problems: The program is not recognising the keyword 'chart'. If you wish to have a look i have attached the file.
 

Attachments

  • OptionCalculator.zip
    11.6 KB · Views: 1,044

Nyptop

Active Member
Licensed User
Longtime User
Sorry, I have added chart module etc. Just uploaded the wrong one. Here is the correct one.
 
Status
Not open for further replies.
Top