Android Tutorial Android Charts Framework

Status
Not open for further replies.
The purpose of this framework is to allow you to easily add different types of charts to your projects.
The current version supports pie charts, line charts and bar charts.

The framework is implemented as code modules. You are free to customize the code as needed.

I also recommend you to go over the code. It demonstrates several concepts including: usage of custom types, drawings, string measurements and region clipping.
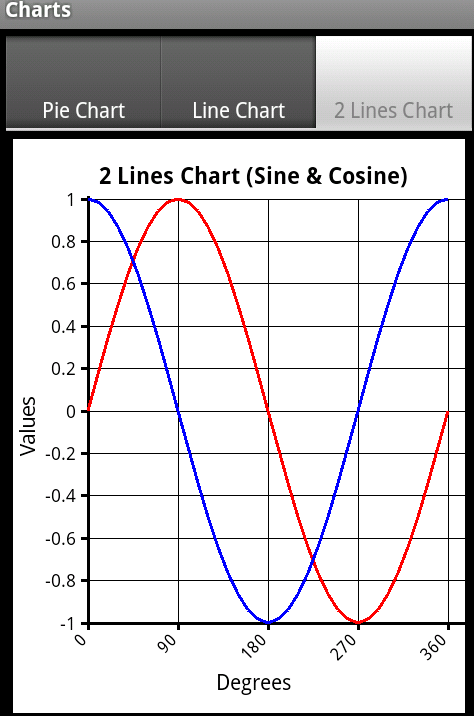
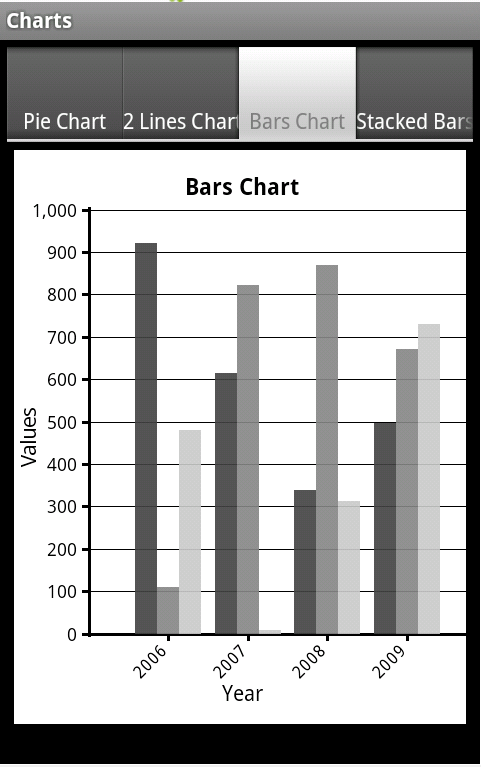
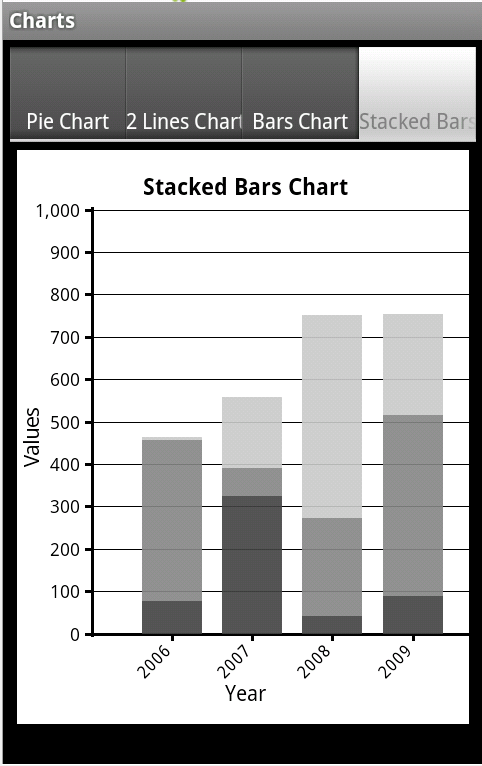
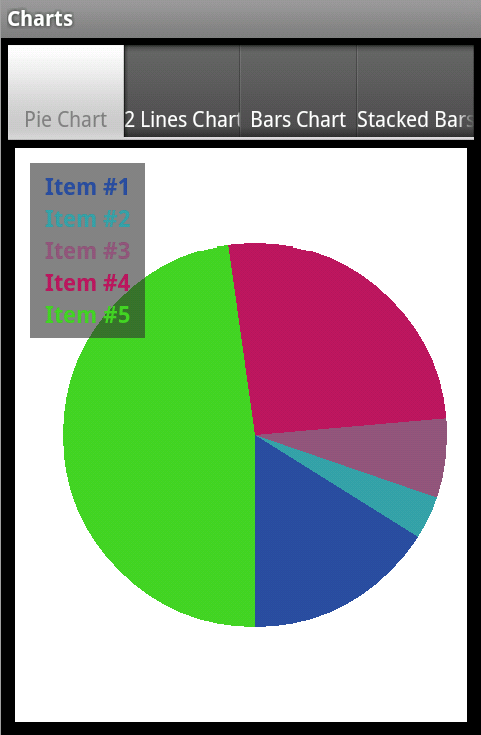
charts_2.png

charts_bars.png

charts_stackedbars.png


charts_pie.png


The code module is attached as part of the example project.
Questions, comments and suggestions are welcomed.

Klaus has posted a version that includes automatic scaling: http://www.b4x.com/android/forum/threads/android-charts-framework.8260/page-7#post-240181
 

Attachments

  • Charts.zip
    9.6 KB · Views: 7,854
Last edited:

chrjak

Active Member
Licensed User
Longtime User
i developed that function modifying the line chart, if somebody need it...

B4X:
Sub DrawAreaChart(G As Graph, LD As LineData, BackColor As Int)
    Dim aree As Map
    If Not(aree.IsInitialized) Then
        aree.Initialize
        aree.Clear
    End If
  
    If LD.Points.Size = 0 Then
        ToastMessageShow("Missing line points.", True)
        Return
    End If
    LD.Canvas.Initialize(LD.Target)
    LD.Canvas.DrawColor(BackColor)

    If LD.AutomaticScale = True Then
        GetLineMinMaxValues(LD)
        CalcScale(G, LD)
    End If

    drawGraph(G, LD.Canvas, LD.Target, LD.Points, False, 0)
    'Draw data lines
    Dim point As LinePoint
    point = LD.Points.Get(0)
  
    'multiple lines
    Dim py2(point.YArray.Length) As Double
    'initialize first point
    For i = 0 To py2.Length - 1
        py2(i) = point.YArray(i)
    Next
    'draw all points
    For i = 1 To LD.Points.Size - 1
        point = LD.Points.Get(i)
        For a = 0 To py2.Length - 1
            If aree.ContainsKey(LD.LinesColors.Get(a)) Then
                Dim linee As Path
                linee = aree.Get(LD.LinesColors.Get(a))
                linee.LineTo(G.GI.originX + G.GI.intervalX * i, calcPointToPixel(point.YArray(a), G))
                If i = LD.Points.Size-1 Then
                    linee.LineTo(G.GI.originX + G.GI.intervalX * i, G.GI.originY)
                End If
                aree.Put(LD.LinesColors.Get(a), linee)
            Else
                Dim linee As Path
                linee.Initialize(G.GI.originX + G.GI.intervalX * (i - 1), G.GI.originY)
                linee.LineTo(G.GI.originX + G.GI.intervalX * (i - 1), calcPointToPixel(py2(a), G))
                linee.LineTo(G.GI.originX + G.GI.intervalX * i, calcPointToPixel(point.YArray(a), G))
                aree.Put(LD.LinesColors.Get(a), linee)
            End If
            py2(a) = point.YArray(a)
        Next
    Next

    For i=0 To aree.Size-1
        LD.Canvas.DrawPath(aree.GetValueAt(i), Colors.Transparent, True, 2dip)
        LD.Canvas.DrawPath(aree.GetValueAt(i), aree.GetKeyAt(i), True, 2dip)
    Next
    drawGraph(G, LD.Canvas, LD.Target, LD.Points, False, 0)

    LD.Target.Invalidate
End Sub
Am I missing something? calcPointToPixel is marked red...
 

deantangNYP

Active Member
Licensed User
Longtime User
HI Erel, Possible to have the X-Axis in float or integer?
Can it be done? This will allow it to space the values on the x-axis correctly. Thanks

AddLinePoint (LD As LineData, X As String, Y As Float, ShowTick As Boolean)

First post was updated with a new version. This version adds support for line charts.
A line chart can show a single line or multiple lines.
Some notes about the line chart:
- The X axis values are treated as strings.
- The Y axis values are treated as numbers.
- The data is added by adding the next X point. For this point you need to supply the Y value in case of a single line, or an array of Y values in case of multiple lines.

The code in the first post demonstrates both a single line and multiple lines charts.

All the drawing code is included in the Charts module. You are free to customize it as needed.
 

klaus

Expert
Licensed User
Longtime User
You can already set x as Float or Int.
If you look at the LineChart and LineChart1 example projects in the User's Guide.
This works:
B4X:
' Add the line points.
For i = 0 To 360 Step 10
    ' In the case of 2 lines or more we are adding an array of values.
    ' One for each line.
    ' Make sure to create an array for each point.
    ' You cannot reuse a single array for all points.
    Charts.AddLineMultiplePoints(LD, i, Array As Float(SinD(i), CosD(i)), i Mod 90 = 0)
Next
This too:
B4X:
' Add the line points.
Dim x As Float
For i = 0 To 500 Step 10
    ' In the case of 2 lines or more we are adding an array of values.
    ' One for each line.
    ' Make sure to create an array for each point.
    ' You cannot reuse a single array for all points.
    x = i / 100
    Charts.AddLineMultiplePoints(LD, x, Array As Float(Rnd(-20,21) + 20, Rnd(-15,16) - 20, CosD(3 * i) * 35), i Mod 50 = 0)
Next
 

deantangNYP

Active Member
Licensed User
Longtime User
Hi Klaus, thanks for the reply. If that's the case, how can i have a correct spacing proportional to the reading on the x-axis?
Please see the picture. Spacing between unit 1 and 2 , should not be the same as spacing between unit 4 and 10.
Thanks. Please advise. Did i do something incorrect?
I am using a simple AddLinePoint for testing.
B4X:
       Charts.AddLinePoint(LD, 0, 0, True )
    Charts.AddLinePoint(LD, 1, 80, True )
    Charts.AddLinePoint(LD, 2, 70, True )
    Charts.AddLinePoint(LD, 3, 40, True )
    Charts.AddLinePoint(LD, 4, 40, True )
    Charts.AddLinePoint(LD, 10, 70, True )

chart1.JPG

https://www.dropbox.com/s/c9cnrnrs48vauco/chart1.JPG?dl=0

You can already set x as Float or Int.
If you look at the LineChart and LineChart1 example projects in the User's Guide.
This works:
B4X:
' Add the line points.
For i = 0 To 360 Step 10
    ' In the case of 2 lines or more we are adding an array of values.
    ' One for each line.
    ' Make sure to create an array for each point.
    ' You cannot reuse a single array for all points.
    Charts.AddLineMultiplePoints(LD, i, Array As Float(SinD(i), CosD(i)), i Mod 90 = 0)
Next
This too:
B4X:
' Add the line points.
Dim x As Float
For i = 0 To 500 Step 10
    ' In the case of 2 lines or more we are adding an array of values.
    ' One for each line.
    ' Make sure to create an array for each point.
    ' You cannot reuse a single array for all points.
    x = i / 100
    Charts.AddLineMultiplePoints(LD, x, Array As Float(Rnd(-20,21) + 20, Rnd(-15,16) - 20, CosD(3 * i) * 35), i Mod 50 = 0)
Next
 

klaus

Expert
Licensed User
Longtime User
Now I understand what you mean.
The LineChart doesn't support what you want to do it supposes equal distances between points.
You would need to add this feature yourself or write your own routine.
That's what I did in the DynSim simulation program.
You might have a look at chapter 11.3.1 Diagrams / Graph example program in the B4A User's Guide.
There are also other diagram or chart libraries in the forum.
 

deantangNYP

Active Member
Licensed User
Longtime User
Now I understand what you mean.
The LineChart doesn't support what you want to do it supposes equal distances between points.
You would need to add this feature yourself or write your own routine.
That's what I did in the DynSim simulation program.
You might have a look at chapter 11.3.1 Diagrams / Graph example program in the B4A User's Guide.
There are also other diagram or chart libraries in the forum.

THANKS for the reply
 

swChef

Active Member
Licensed User
Longtime User
Has anyone looked into making this available as/in a service, to create a chart for a purpose other than live Activity display ?
Or is there a better alternative for that case?
 

swChef

Active Member
Licensed User
Longtime User
I didn't have time to review it today, but did you mean (a few changes) in the library itself, or is it possible on the application side? From my efforts this past weekend I think modifying the library is necessary.
 

Rob Bliss

Member
Licensed User
Longtime User
Has anyone been clever enough to show a popup panel when clicking a portion of a Stacked Bar Chart?? I've tried replacing the panel and canvas from BarData with ones created in the activity, but can't get the panel_touch/click events to fire (I figured BD.Target_Click wouldn't work either due to the fullstop), let alone register which section of the chart it has touched.

Any help is much appreciated.
 

Rob Bliss

Member
Licensed User
Longtime User
What exactly do you want to do?
What kind of data do you want to display?

I've done it now, after a bit of fiddling, using xCharts, but the idea was to click/touch a section of a stacked column, or just the column, then for a panel to appear displaying things like the value of the section, the column. Maybe colour the section names and display all the values at once. Just anything to give that bit more information. The solution given with xCharts more than suits my needs.
 

pazzokli

Active Member
Licensed User
Longtime User
Hi, I would like keep tablet in portrait mode but see line graph with x axis in vertical
Is it possible?
 
Status
Not open for further replies.
Top