Android Tutorial Android Charts Framework

Status
Not open for further replies.
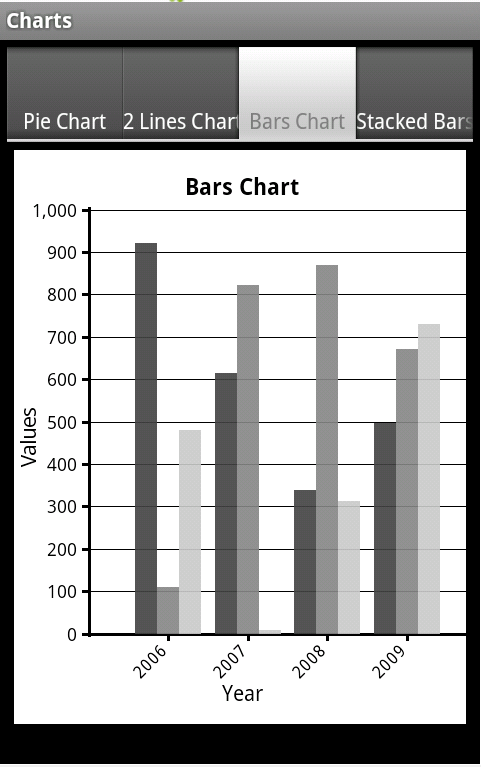
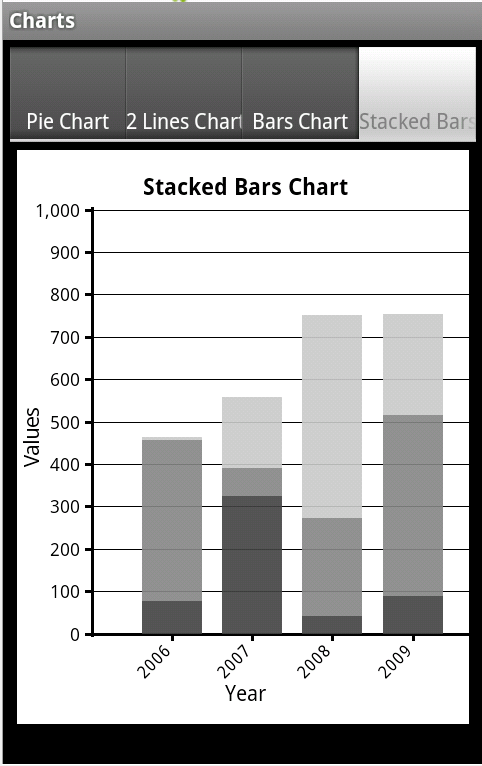
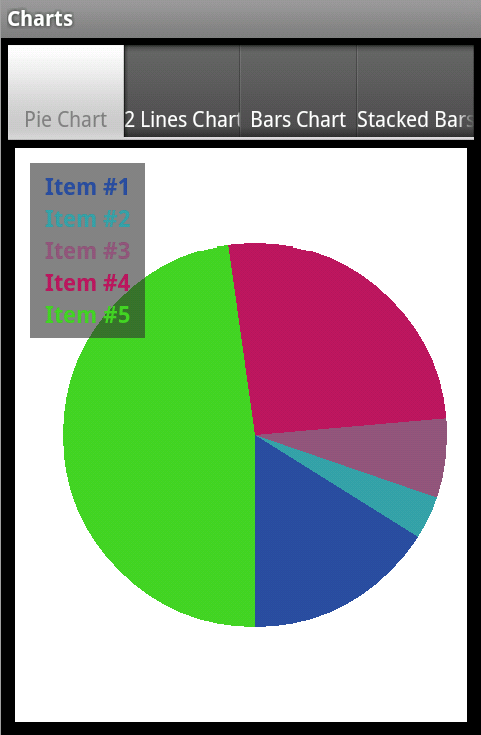
The purpose of this framework is to allow you to easily add different types of charts to your projects.
The current version supports pie charts, line charts and bar charts.

The framework is implemented as code modules. You are free to customize the code as needed.

I also recommend you to go over the code. It demonstrates several concepts including: usage of custom types, drawings, string measurements and region clipping.
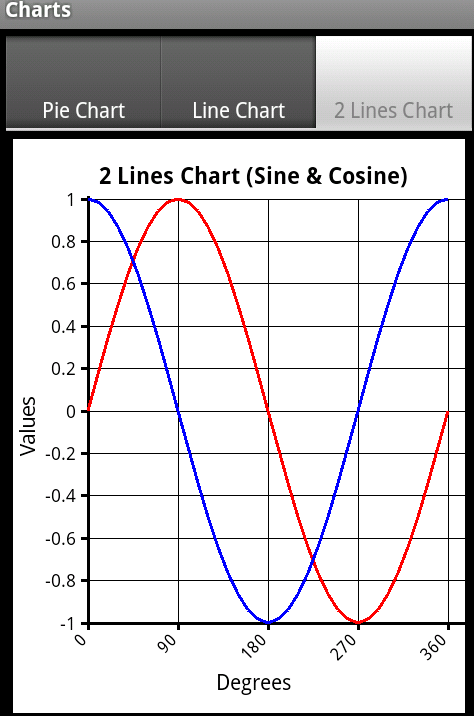
charts_2.png

charts_bars.png

charts_stackedbars.png


charts_pie.png


The code module is attached as part of the example project.
Questions, comments and suggestions are welcomed.

Klaus has posted a version that includes automatic scaling: http://www.b4x.com/android/forum/threads/android-charts-framework.8260/page-7#post-240181
 

Attachments

  • Charts.zip
    9.6 KB · Views: 7,890
Last edited:

sanjibnanda

Active Member
Licensed User
Longtime User
Animating a chart needs to modify the drawing routine in the Chart module and use a Timer to delay the drawing of each bar.

Best regards.

sir,

i tried it with some delay/delays in drawGraph routine. The bars flash as a whole after the applied delay. The pixel drawing is not being animated. Could you pin point where i have to put a delay?

thanks and regards,

sanjib
 

sanjibnanda

Active Member
Licensed User
Longtime User
Attached you find an example.
It's based on the BarChart example from the User's Guide.
You can modulate the speed in the BarTimer.Initialize method.

Best regards.

wow! excellent work and help, thanx 2 much.
but i was looking for bar animation as attached a swf file in zip file.
hope this is also possible..
however, you people @ B4A are wonderful and supportive.
Regards,
sanjib
 

Attachments

  • charts.zip
    63.7 KB · Views: 626

klaus

Expert
Licensed User
Longtime User
hope this is also possible..
Yes,
but a bit more complicated.
It would probably be more efficient to write a specific set of routines for this task rather than modifying the Charts module.

Best regards.
 
Last edited:

stu14t

Active Member
Licensed User
Longtime User
Reverse Axis

How easy is it to reverse the y axis? i.e so the origin moves to the top left but the X axis remains the same but is now at the top of the chart.

Also, are click events possible to pick data points along the line graph created which returns the data coordinates?

Many thanks.

Stu
 

TeoApp

Member
Licensed User
Longtime User
pitch and zoom

is it possible to add pitch and zoom on chart's panel ? i'd like to zoom the bars :icon_clap: thks in advance
 

miquelr

Member
Licensed User
Longtime User
text into pie items

I'm using the 'chart framework' and, for various reasons, I can not use the 'legend'. I want the text of each parameter 'Name' appeared insaid the corresponding 'pie item'. This text label should have the same angle as the pie item, but the text itself should be rotated 0 or 180 depending on whether you are in the right or left side of the circle (so you do not see the reverse text)

I've spent too many hours trying to solve it without success and I need help because this chart is a fundamental part of the software that I invested many efforts.
thanks in advance.
Miquel
 

hdtvirl

Active Member
Licensed User
Longtime User
Miquel, I had to do something similar when producing charts and I used the Canvas.DrawTextRotated command to put the text onto charts I was producing.

Best of Luck.

hdtvirl
 

kordou

Member
Licensed User
Longtime User
axis

Hi,

Could someone tell me how I can add value to X axis please ;

thank you
 

goron

Member
Licensed User
Longtime User
Canvas.DrawText

Try to play with:
Canvas.DrawText

For example I'm using letters instead of digits:
If p.x.Length > 0 Then
abName = "A"
If p.x = 2 Then abName = "B"
If p.x = 3 Then abName = "C"
If p.x = 4 Then abName = "D"
Canvas.DrawTextRotated(abName, x, GI.originY + 12dip, Typeface.DEFAULT, 12, G.AxisColor, "RIGHT", -45)
End If

HTH, Gideon Oron
 

goron

Member
Licensed User
Longtime User
axis

Try something similar as follows:

Values:
Dim input1(4) input2(4) As Float
For i = 1 To 4
Charts.AddBarPoint(bd, i, Array As Float (input1(i-1), input2(i-1) ))
Next

Names:
1.
G.XAxis = "Riddle No. " & RiddleNo

2. Inside the module.
For example I'm using letters instead of digits:
If p.x.Length > 0 Then
abName = "A"
If p.x = 2 Then abName = "B"
Canvas.DrawTextRotated(abName, x, GI.originY + 12dip, Typeface.DEFAULT, 12, G.AxisColor, "RIGHT", -45)
End If

HTH, Gideon Oron
 

elbelli2008

Member
Licensed User
Longtime User
move Line at chart

Hi Erel,

We can move data over de graphics?

for example

I have draw a line, and I need move and rotate this line over de chart..

thanks
 
Status
Not open for further replies.
Top