Android Tutorial Android Charts Framework

Status
Not open for further replies.
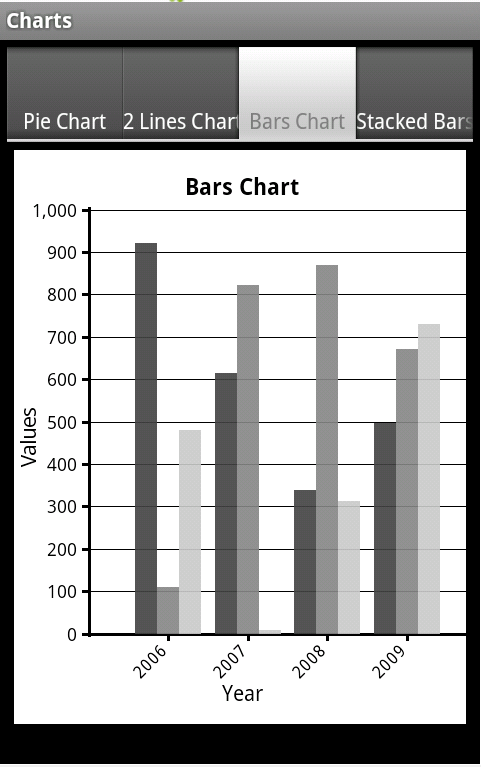
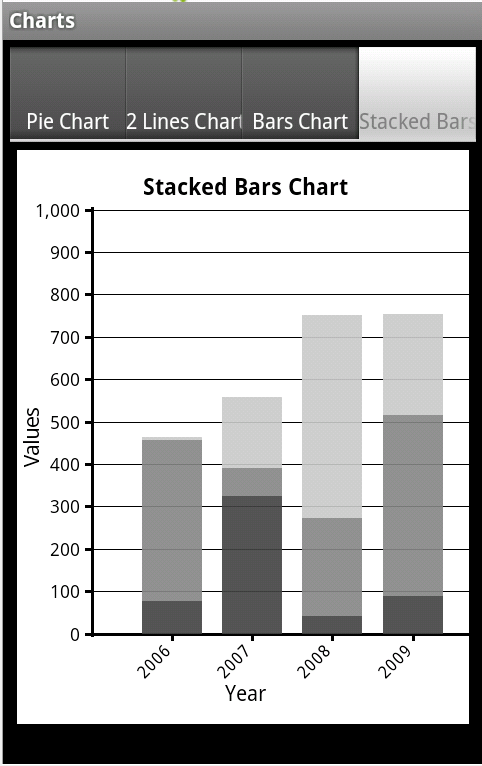
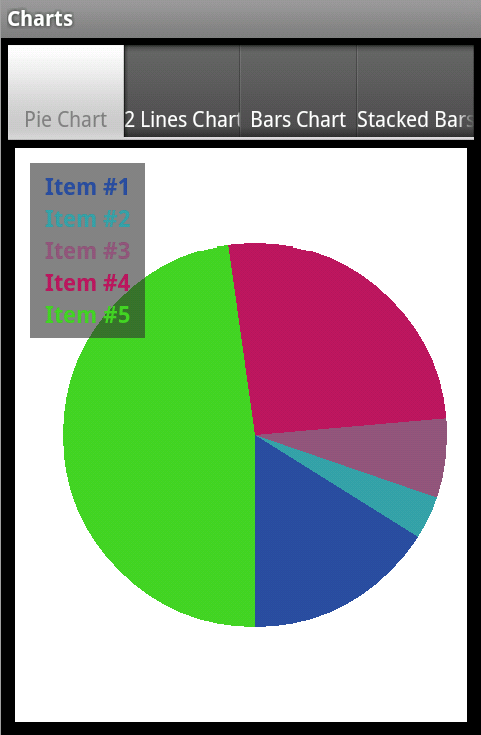
The purpose of this framework is to allow you to easily add different types of charts to your projects.
The current version supports pie charts, line charts and bar charts.

The framework is implemented as code modules. You are free to customize the code as needed.

I also recommend you to go over the code. It demonstrates several concepts including: usage of custom types, drawings, string measurements and region clipping.
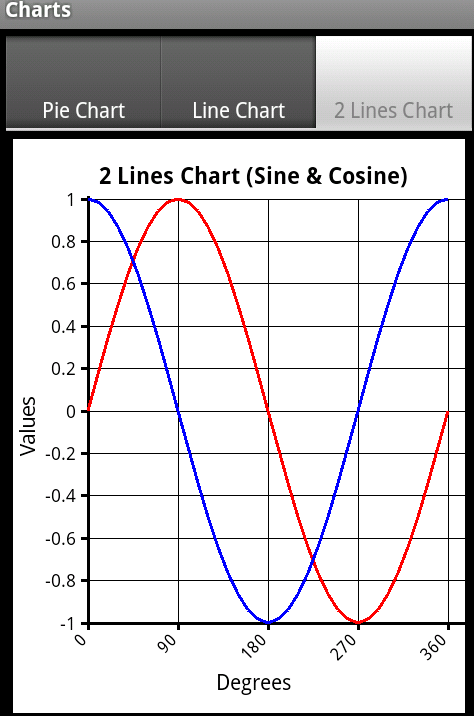
charts_2.png

charts_bars.png

charts_stackedbars.png


charts_pie.png


The code module is attached as part of the example project.
Questions, comments and suggestions are welcomed.

Klaus has posted a version that includes automatic scaling: http://www.b4x.com/android/forum/threads/android-charts-framework.8260/page-7#post-240181
 

Attachments

  • Charts.zip
    9.6 KB · Views: 7,854
Last edited:

CharlesR

Member
Licensed User
Longtime User
Here you are.
No change in the Graph module, the clearing is done in the main code.
The modified lines have a 'klaus comment.

Best regards.

Hi Klaus

Thanks very much for that. I will study your code and hopefully improve my knowledge. I am wondering if there is a memory problem with erase graph as it produces "Unfortunately, USB Serial Example has stopped" after 23 graphs have been drawn on my Asus Transformer. I have run it 5 times and this is consistent.

I would appreciate your thoughts.

Thanks again.

Charles
 

klaus

Expert
Licensed User
Longtime User
Sorry, I hadn't seen this.
Here you are, the modifications are commented with 'klaus1.
I had to move
pnl2Lines.Initialize("pnl2Lines") 'klaus1
pnlPgraph.AddView(pnl2Lines, 0, 0, 55%x, 100%y - 100dip) 'klaus1

from btnGraph_Click to Activity_Create.

Best regards.
 

Attachments

  • graph1_New1.zip
    77.6 KB · Views: 544

CharlesR

Member
Licensed User
Longtime User
Sorry, I hadn't seen this.
Here you are, the modifications are commented with 'klaus1.
I had to move
pnl2Lines.Initialize("pnl2Lines") 'klaus1
pnlPgraph.AddView(pnl2Lines, 0, 0, 55%x, 100%y - 100dip) 'klaus1

from btnGraph_Click to Activity_Create.

Best regards.

Thank you very much Klaus.

Kind regards

Charles
 

lorebarita

Member
Licensed User
Longtime User
Hi. I dont know if I am asking for too much but is there a way I can combine two graphs in the same panel like I show a bargraph and a linegraph at the same time. I have tried but it first draws one chart but then the second overwrites it. See what I have tried
 

Attachments

  • AnimatedBarChart.zip
    357.3 KB · Views: 566

Mashiane

Expert
Licensed User
Longtime User
To have the bar chart draw different colors each time its redrawn change the AddBarColor sub to this..

B4X:
Sub AddBarColor(BD As BarData, Color As Int)
    If BD.BarsColors.IsInitialized = False Then BD.BarsColors.Initialize
    'the line below is taken from the add pie point method
    If Color = 0 Then Color = Colors.RGB(Rnd(0, 255), Rnd(0, 255), Rnd(0, 255))
    BD.BarsColors.Add(Color)
End Sub
 

Mashiane

Expert
Licensed User
Longtime User
The x axis values are drawn at 45 degrees. By changing the value to 90 degrees, the axis text will appear straight up

From
B4X:
Canvas.DrawTextRotated(p.x, x, GI.originY + 12dip, Typeface.DEFAULT, 12, G.AxisColor, "RIGHT", -45)

To

B4X:
Canvas.DrawTextRotated(p.x, x, GI.originY + 12dip, Typeface.DEFAULT, 12, G.AxisColor, "RIGHT", -90)
 

MichaelAust

Member
Licensed User
Longtime User
Nice Framework, I would suggest in Sub DrawBarsChart that

B4X:
  If BD.Points.Size = 0 Then

be changed to

B4X:
  If (BD.Points.IsInitialized=False) OR (BD.Points.Size = 0) Then

otherwise you get an error if you added no points (did that when I was debugging)

Also it would be great if you could add an option for X,Y Graphs, ie points or lines that can go to any X,Y point rather than simply going from left to right (sometimes called a Scatter plot).
 
Last edited:

qsrtech

Active Member
Licensed User
Longtime User
Has anybody updated the chart framework to do horizontal bar charts yet?
 

TedDog

Member
Licensed User
Longtime User
Very helpful module, Erel. Thank you. Is it possible to save a chart as a jpg or gif? I'd like to allow users to email their charts as an attachment.
 

klaus

Expert
Licensed User
Longtime User
Yes, with the routine below you get the bitmap of the chart panel.
B4X:
Sub GetBitmap(pnl As Panel) As Bitmap
    Dim bdw As BitmapDrawable
  
    bdw = pnlLines.Background
    Return bdw.Bitmap
End Sub
Then you can save it with the code below
B4X:
Dim bmp As Bitmap
bmp = GetBitmap(pnlChart)
Dim Out As OutputStream
Out = File.OpenOutput(File.DirRootExternal, "Test.png", False)
bmp.WriteToStream(out, 100, "PNG")
Out.Close
 

enrico

Active Member
Licensed User
Longtime User
I'd like to use StackedBarsChart but I have different numbers of y values for every x value.
How can I modifiy Charts.AddBarPoint to add arrays with indefinite size ?
And colors with Charts.AddBarColor ?
 

enrico

Active Member
Licensed User
Longtime User
That's a good idea. Thanks.
What about having different bars colors ?
For example in a day I can have item1 with value1 and item2 with value2 (in the stacked bar).
Next bar is next day where I can have item3, item4 and item5 with their values.
And I'd like to keep the colors of the same item (I already have a map with item as keys and colors as values).
After that the desire is to create a legend showing items and associated colors (probably using scrollview because items are many).
 
Status
Not open for further replies.
Top