Android Tutorial Android Charts Framework

Status
Not open for further replies.
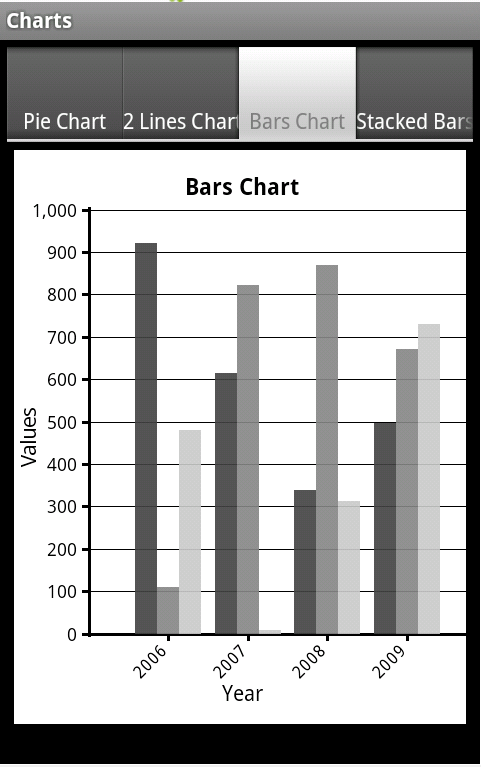
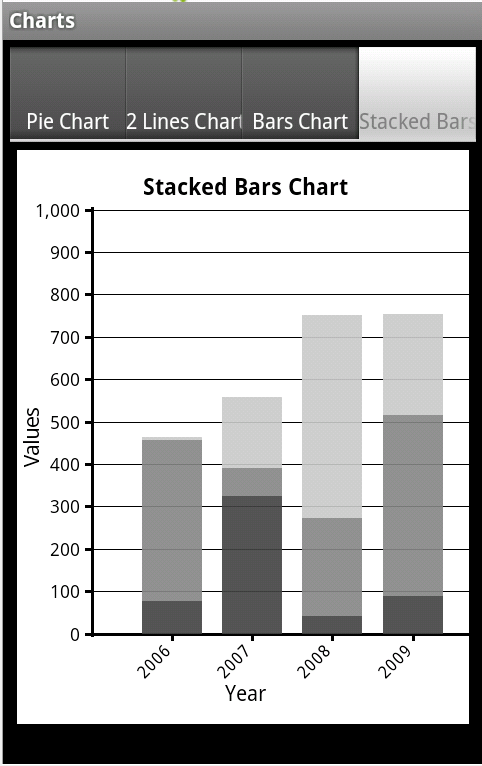
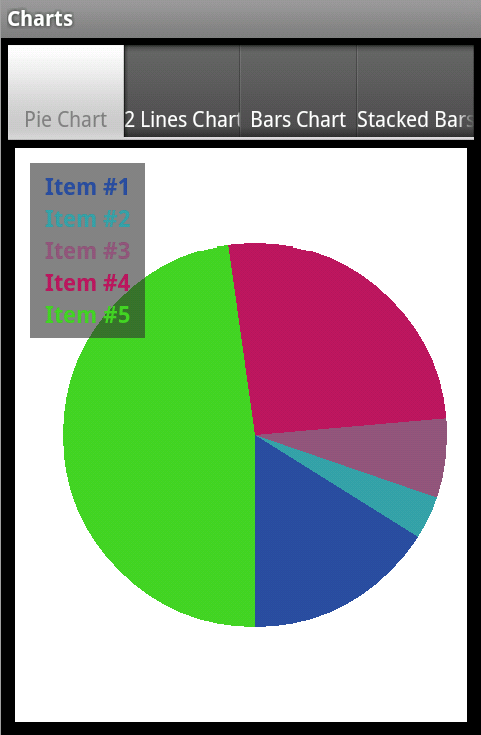
The purpose of this framework is to allow you to easily add different types of charts to your projects.
The current version supports pie charts, line charts and bar charts.

The framework is implemented as code modules. You are free to customize the code as needed.

I also recommend you to go over the code. It demonstrates several concepts including: usage of custom types, drawings, string measurements and region clipping.
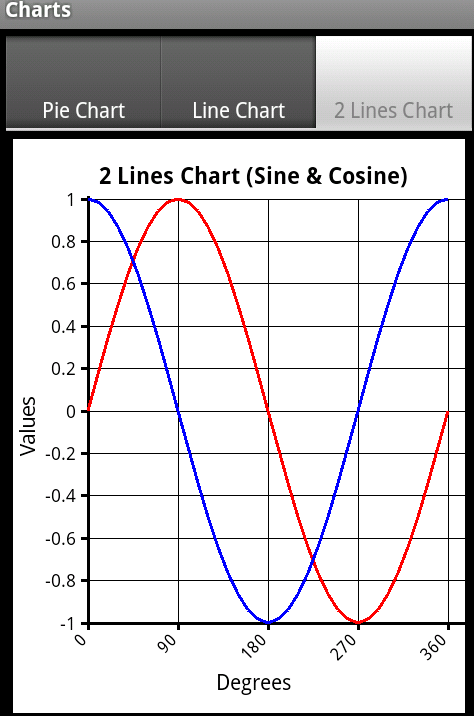
charts_2.png

charts_bars.png

charts_stackedbars.png


charts_pie.png


The code module is attached as part of the example project.
Questions, comments and suggestions are welcomed.

Klaus has posted a version that includes automatic scaling: http://www.b4x.com/android/forum/threads/android-charts-framework.8260/page-7#post-240181
 

Attachments

  • Charts.zip
    9.6 KB · Views: 7,854
Last edited:

enrico

Active Member
Licensed User
Longtime User
Are you saying the code in charts module or in the activity ?
Do you think I have to modify the Type definitions in charts module to pass the colors ?
 

klaus

Expert
Licensed User
Longtime User
The easiest way to do what you want is.
- define the max number of possible items
- add a color for each item with Charts.AddBarColor
- and in the Charts.AddBarPoint routine set the value of missing items to 0, as Erel already suggested
With this no need to modify the Chart module code.

For creating a legend showing items and associated colors I suggest you to do it in a separate ScrollView.
 

enrico

Active Member
Licensed User
Longtime User
I was trying to do so, but it always take the first colors.
Surely I have done something wrong.
I have set a map with :
item1, color1
item2, color2
item3, color3
........

Added colors in graph with :
B4X:
    For i = 0 To ItemNumber - 1
        Charts.AddBarColor(BD, MakeTransparent(ItemColor(i), 230))
    Next

If in a day I have only item4 and item5, anyway it takes color1 and color2 (see pic)
 

Attachments

  • pic.jpg
    pic.jpg
    15.1 KB · Views: 485

enrico

Active Member
Licensed User
Longtime User
Solved. Thanks.
I had two problems.
First I have ordered the sql query by value descending, so first values were always associated to the same first colors.
Second I had to use a list to get the correct index of items (map type can't do it I think).

Now how can I draw a horizontal straight line at a specific position of the y axis ?
 
Last edited:

klaus

Expert
Licensed User
Longtime User
You can add this routine to the Charts module:
B4X:
'Draws a horizontal line at the given y value
'y = y value
'Color = color of the line and the text
'Stroke = line thickness in pixels
Sub DrawHorizontalLine(G As Graph, BD As BarData, y As Double, Color As Int, Stroke As Float)
    Dim x1, x2, y1 As Float
    x1 = G.GI.originX
    x2 = G.GI.originX + G.GI.gw
    y1 = G.GI.maxY + (G.YEnd - y) * G.GI.gh / (G.YEnd - G.YStart)
    BD.Canvas.DrawLine(x1, y1, x2, y1, Color, Stroke)
    BD.Target.Invalidate
End Sub
And in the calling module after Charts.DrawBarsChart:
B4X:
Charts.DrawHorizontalLine(G, BD, y, Colors.Blue, 2dip)
 

enrico

Active Member
Licensed User
Longtime User
Klaus the Master !
As it was too easy for you, I will test your patience asking to put a small description label above that line.
 

klaus

Expert
Licensed User
Longtime User
I was sure that this would have been the next question :).

You can add this routine to the Charts module:
B4X:
'Draws a horizontal line at the given y value
'A text can be displayed
'y = y value
'Color = color of the line and the text
'Stroke = line thickness in pixels
'Text = text to draw
'Align = alignment
'      "LEFT" aligned
'      "CENTER" in the center
'      "RIGHT" aligned
'      "NONE" no text drawn
Sub DrawHorizontalLineText(G As Graph, BD As BarData, y As Double, Color As Int, Stroke As Float, Text As String, Align As String)
    Dim x1, x2, y1 As Float
    x1 = G.GI.originX
    x2 = G.GI.originX + G.GI.gw
    y1 = G.GI.maxY + (G.YEnd - y) * G.GI.gh / (G.YEnd - G.YStart)
    BD.Canvas.DrawLine(x1, y1, x2, y1, Color, Stroke)
    Select Align
    Case "LEFT"
        BD.Canvas.DrawText(Text, x1 - 2dip, y1 + 4dip, Typeface.DEFAULT, 12, Color, "RIGHT")
    Case "CENTER"
        BD.Canvas.DrawText(Text, (x1 + x2) / 2, y1 - 2dip, Typeface.DEFAULT, 12, Color, "CENTER")
    Case "RIGHT"
        BD.Canvas.DrawText(Text, x2 + 2dip, y1 + 4dip, Typeface.DEFAULT, 12, Color, "LEFT")
    End Select
    BD.Target.Invalidate
End Sub
And in the calling module some examples.
B4X:
Charts.DrawHorizontalLine(G, BD, y, Colors.Blue, 2dip, y, "LEFT") 
Charts.DrawHorizontalLine(G, BD, 1150, Colors.Red, 2dip, "Max", "RIGHT") 
Charts.DrawHorizontalLine(G, BD, 450, Colors.Red, 2dip, "Min", "RIGHT") 
Charts.DrawHorizontalLine(G, BD, 850, Colors.Black, 2dip, "", "NONE") 
Charts.DrawHorizontalLine(G, BD, 650, Colors.Black, 2dip, 650, "CENTER")
 

enrico

Active Member
Licensed User
Longtime User
Very well.
I like that way I've added :
B4X:
    Case "LEFTUP"
        BD.Canvas.DrawText(Text, x1 + 2dip, y1 - 2dip, Typeface.DEFAULT, FontSize, Color, "LEFT")
Called by :
B4X:
Charts.DrawHorizontalLineText(G, BD, Target, Colors.White, 2dip, strTarget, "LEFTUP")

I suggest to include this methods in next Chart module update.
I find useful to pass a FontSize variable in all the other subs too.
 

dieterp

Active Member
Licensed User
Longtime User
With the Create2LinesTab example (Charts.AddLineMultiplePoints), is it possible to 'stop' drawing one of the lines while continuing with the other? Let's say the 1st line goes up to an x value of 100, but the 2nd line must stop being drawn at an x value of 80. Can this be done?
 

chrjak

Active Member
Licensed User
Longtime User
How to autoscale G.Yinterval?
Dependend on the max y and min y value!?

Regards
 

chrjak

Active Member
Licensed User
Longtime User
I don't know how to do that... I tried it already but i think if the values are sooo different, that my system will crash
 

klaus

Expert
Licensed User
Longtime User
I tried it already but i think if the values are sooo different, that my system will crash
What have you tried. Why should the app crash ?
The autoscale calculation depends also on what kind of scale you want.
What kind of data do you want to display ?
 

chrjak

Active Member
Licensed User
Longtime User
here my code:
G.YStart = unterpunkt - 10
G.YEnd = hochpunkt + 10
G.YInterval = 10

But the Problem is, that if the value unterpunkt = 0 and if the value hochpunkt = 999999999 then there would be too much again.
and if the values are unterpunkt = 0, hochpunkt = 1 then it would be too small... :(
 

klaus

Expert
Licensed User
Longtime User
Again, what kind of data do you want to display ?
One possibility is to set the base to unterpunkt and the top to hochpunkt and divide the difference by the number of lines and set the intermediate values according to this.
The only 'problem' is that the units are evreything but 'standized'.
To write a scaling routine is possible but then you would probably also need to adapt the space between the chart border and the grid border.
 
Last edited:
Status
Not open for further replies.
Top